PitchVision — Tracking a Soccer Player’s Functional Vision in Field Drills
PitchVision is a field-side web app for a soccer coach. A coach enters a player and the day’s conditions, logs the drills that player ran, and the app turns those counts into measures a coach can actually use: cue-identification accuracy, missed cues, response time, head scans per minute, and decisions made before receiving a pass. Every later session is shown against that player’s own earlier ones, so a training block shows up as a trend line rather than as a folder of numbers.
It is not a vision test. The app records what happened in a drill on a given day, and it says so on every screen: these results describe drill performance only, they are not a medical diagnosis, they do not measure eyesight or screen for vision problems, and they are not a substitute for an eye-care assessment. A player or parent who is worried about vision should see an optometrist or an ophthalmologist.
Tools and approach
- BUILT WITH: plain HTML, CSS and JavaScript — one page, one stylesheet and eight modules, about 3,000 lines of app source. No framework, no build step, no dependencies, no server, no API key, no accounts. Open the URL on a phone and add it to the home screen and it works with no signal once loaded.
- DATA: a session is the player label, the drill date, four condition fields (surface, light, weather, ball) and one short notes line, plus one block per drill with its counts and times. Nothing else is collected — no video, no photos, no birth dates, no medical history, and no free-text field anywhere near big enough to paste a diagnosis into.
- WHERE IT LIVES: the browser’s own local storage, so a session logged on a pitch stays on that device, offline, with nothing uploaded. That is also why there is no database: this is a single-device coaching tool, so SQLite would have added a server, a backup problem and an attack surface to buy nothing. What a coach does need is a way to move the data, so there is a JSON back-up, a lossless import that merges by record, and a CSV export with one row per drill block for a spreadsheet.
- THE DRILLS: peripheral cue identification while dribbling (numbered or coloured cues shown in the far periphery, called without turning the head); decision before receiving (a cue shown as the ball is served, called before the first touch, then played); scanning and awareness in a small-sided game (head scans counted by an observer); and a custom drill that uses the same measures so it stays comparable.
- VALIDATION: nothing is stored until every field passes. The save button stays disabled and each problem is written next to the field it belongs to. Whole numbers only where a count is expected, duration 0.5–180 minutes, response time 0.05–20 seconds, correct answers can never exceed chances presented, completed passes can never exceed passes attempted, the date must be a real date and not in the future, and a scan count above 120 per minute is refused as a probable mis-count or a wrong duration.
- NOTE: the derived measures are computed, never typed in. Missed cues are chances presented minus correct answers; scans per minute normalises short and long blocks so they compare fairly; the drill index is a within-session summary (accuracy 50%, response time 30%, scanning 20%, weights re-balanced when a measure was not recorded) and the app labels it as a coaching summary rather than a clinical score.
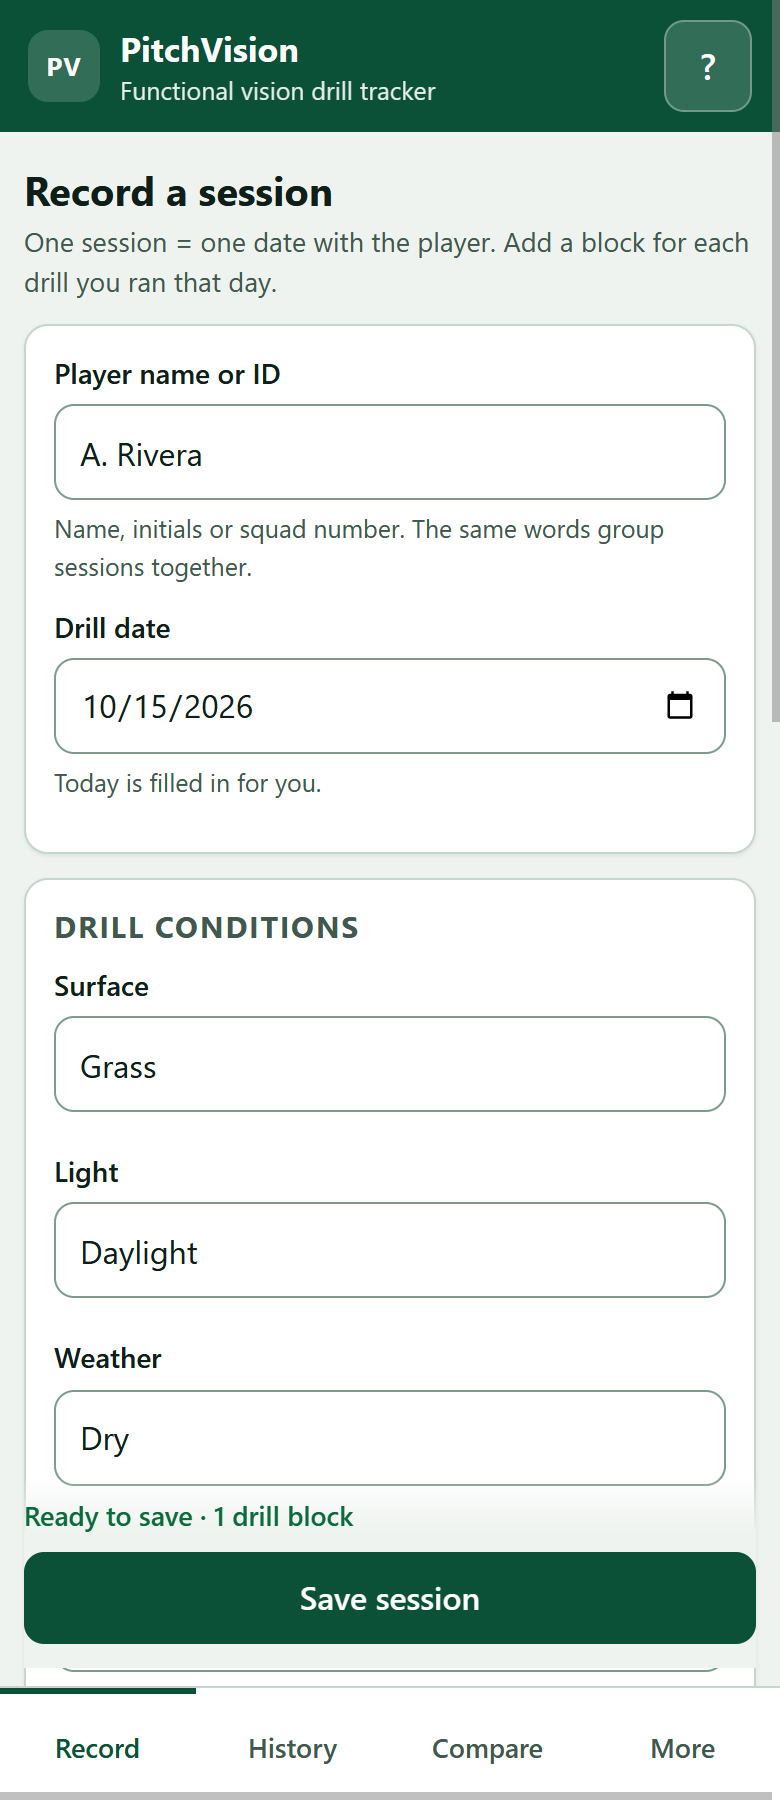
Logging a session takes one screen. Pick the player and the date, set the conditions, then fill a block per drill. Response time is the awkward one to measure by hand, so there is a tap timer: start it when the cue goes up, stop it when the player answers, and after a few reps the mean is filled in with the fastest rep recorded next to it.
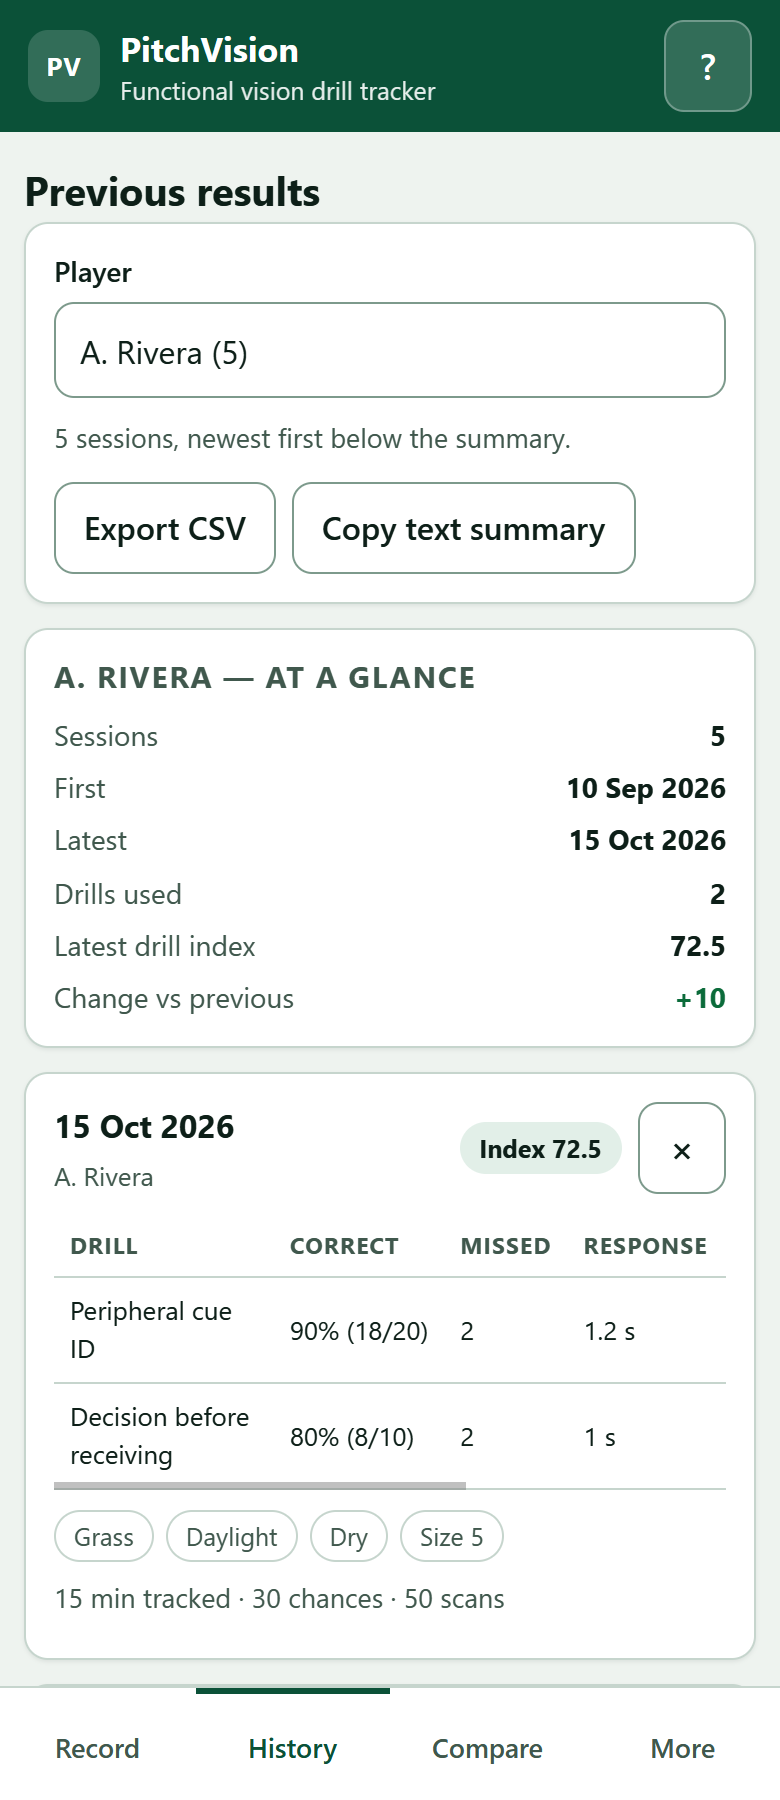
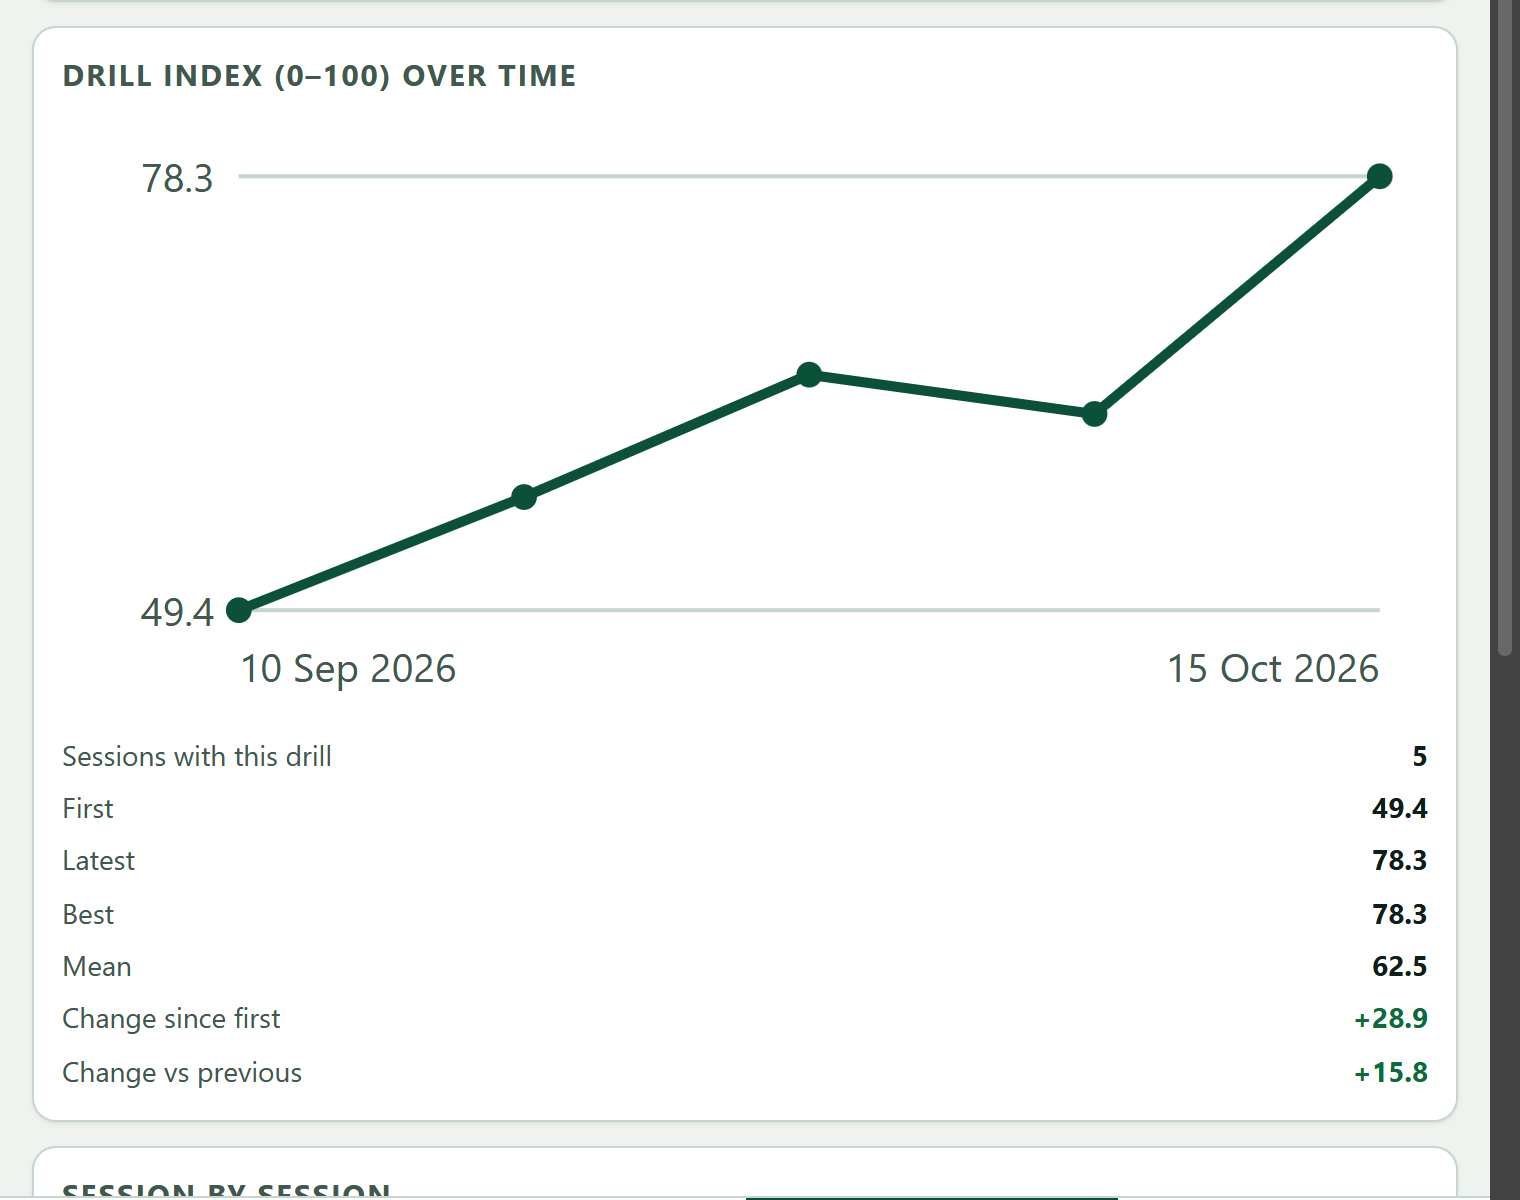
The comparison screen is where the app earns its keep. Pick a player, a drill and a measure, and the same drill is plotted across every session that player has run, with the change since the first session and the change since last time. The two are different numbers and both matter: a player coming back from injury can be well above their first session and still down on last week. Scans per minute and the drill index exist for the same reason — they are the two ways to see practice changing something without inventing a score that pretends to be clinical.
Review
THE GOOD: keeping the maths in pure functions — no DOM, no storage — is what made the rest of the project cheap. metrics.js, stats.js, validate.js and csv.js take data and return data, so the whole model is covered by 51 tests that run in 77 milliseconds with nothing installed. The tests that earned their keep assert relationships rather than numbers: a faster or more accurate session can never score lower, the index can never leave 0–100, the weights must re-normalise when a measure was not recorded, and the CSV writer is proved well formed by a quote-aware reader rather than by eyeballing a file.
THE BAD: the deployed copy served 30-day immutable caching on every asset — Cache-Control: immutable, max-age=2592000 — while the HTML was never cached at all. So a redeploy under the same filename was invisible: the page refreshed, the code did not, and the bug looked unfixed. Two separate deploys were spent chasing that before it was measured. The fix is a ?v=N on every asset URL, bumped in one place by a script, plus a check that refuses a half-bumped tree (a module imported under two different query strings is instantiated twice, which would silently give the app two copies of its state). The deploy verifier now fetches assets with the versioned URL a browser would use, rather than the bare one.
THE UGLY: three defects survived a green test suite and were found only by driving the deployed app in a real browser. Block field ids mixed two separators, so the fields could not be addressed directly. The History screen said “oldest first” while rendering newest first. And the “All players” summary was comparing one player’s latest index against a completely different player’s previous session — a number that looked completely reasonable and meant nothing. None of those are logic bugs; they are the class of bug that only exists once the thing is on screen, which is why the browser run is now part of the checklist and not a nicety.
What we learned
A deployed build is not a verified build. Every count-based check passed while two screens were saying the wrong thing and a redeploy was silently not arriving. The cheap habit that caught all three was opening the deployed URL and using it the way a coach would — filling the form, saving, reloading, switching tabs — and reading what came back.
Derived numbers should be computed, never typed. Missed cues are chances presented minus correct answers, and the app never asks for them. Every measure that could be derived was, which removed a whole class of entries that could disagree with each other.
Not everything belongs in one score. The drill index is a compression of three different things into one 0–100 number, and it is the least trustworthy figure on the screen. It is shown next to the measures it is built from, its weights are printed in the help, and it is described as a coaching summary — because the moment a number like that is presented as a verdict, a coach stops reading the three measures underneath it.
And the one that carries over from the last project: the app deliberately refuses to be more than it is. It does not measure eyesight, it does not diagnose anything, and the note saying so is in the app, in the README and here. A tool that a coach shows a parent about their child has to be honest about that boundary before it is asked.