Soccer Factory — Soccer as Industrial Engineering
Soccer Factory is a free web app that uses the game you already play to teach the subject you have probably never been taught: Industrial Engineering — the study of how to arrange people, machines and space so that work gets done without anyone drowning.
Here is the idea in one sentence: a football team and a factory floor are both space with moving agents, jobs arriving, and limits on how fast things get done. If you can work out how much of the pitch your midfield can shut down in three seconds, you already have the maths for how much of a warehouse six operators can serve in thirty. One engine in the app runs both, and a single ⚽ / 🏭 toggle at the top of every page switches between them.
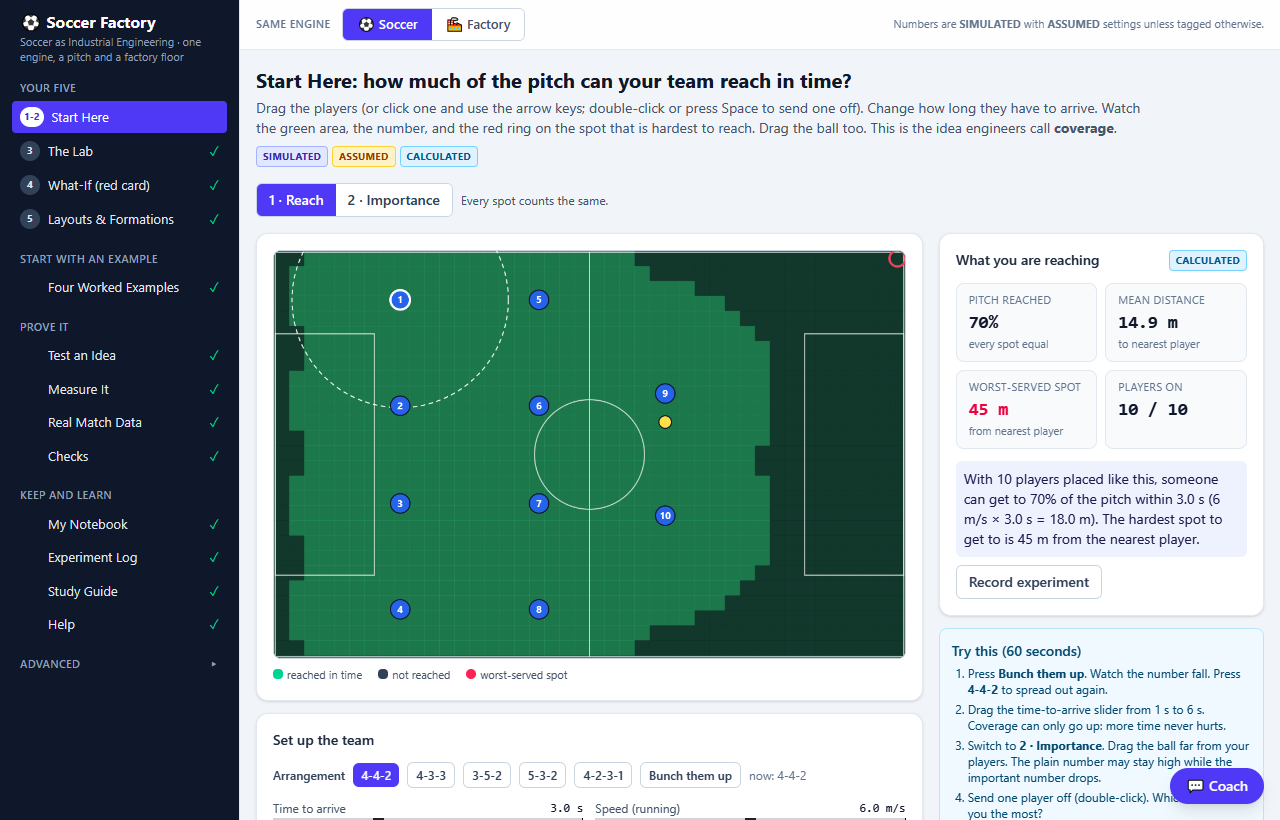
Try it in sixty seconds
- Open the app (button at the bottom of this page). You land on Start Here, with a pitch and eleven players.
- Press Bunch them up. The big number — how much of the pitch your team can reach in three seconds — drops from 70% to 17%. Press 4-4-2 to spread out again.
- Now press 🏭 Factory in the top bar. Same engine, same question, different world: six operators, racks you cannot walk through, and stations that need serving. The number becomes 42%, because a person walks at 1.4 m/s and a player runs at 6.
That is the whole project in three clicks: the shape matters more than the effort, and the same shape question appears in both places.
Four worked examples
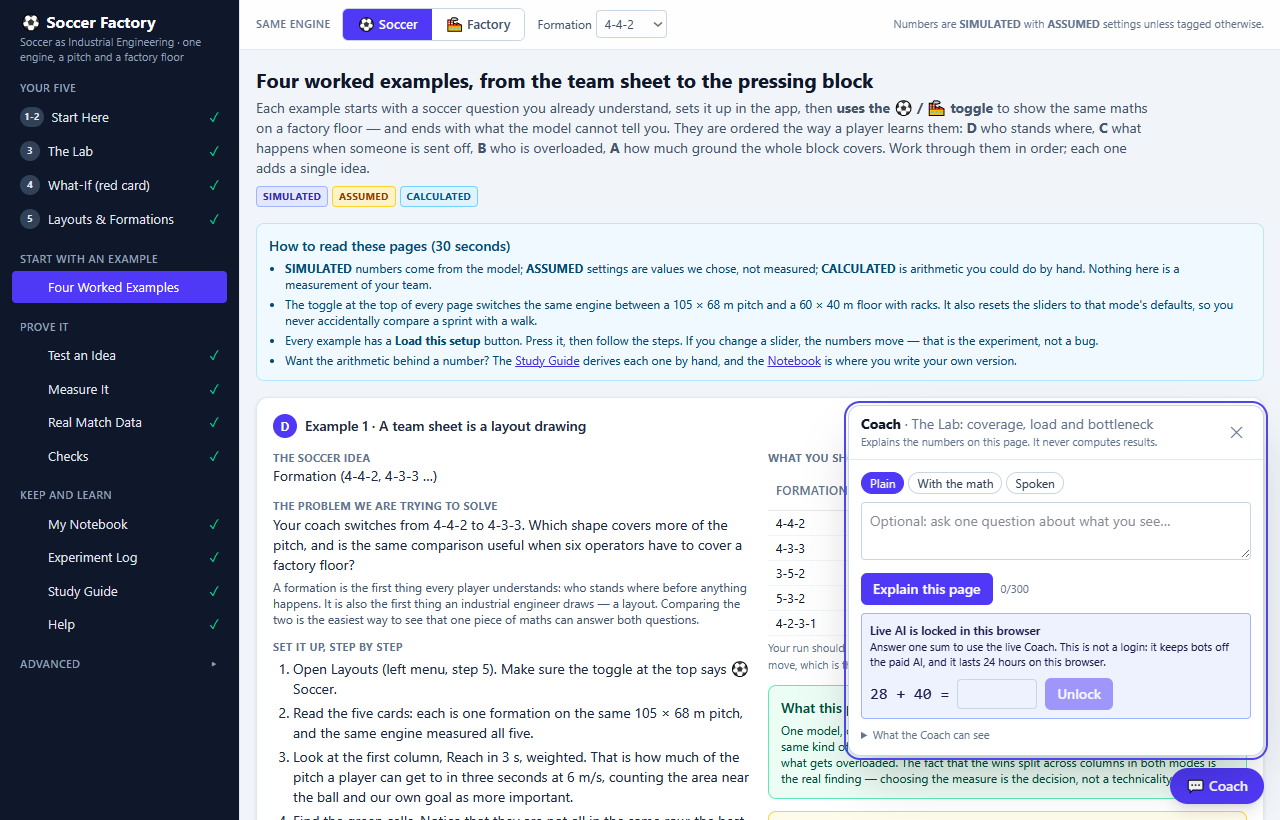
These are in the order a player learns them — the simplest soccer idea first, the most advanced last. Each one tells you the problem, how to set it up, what to do with the toggle, and then the part most demos skip: what the model cannot tell you.
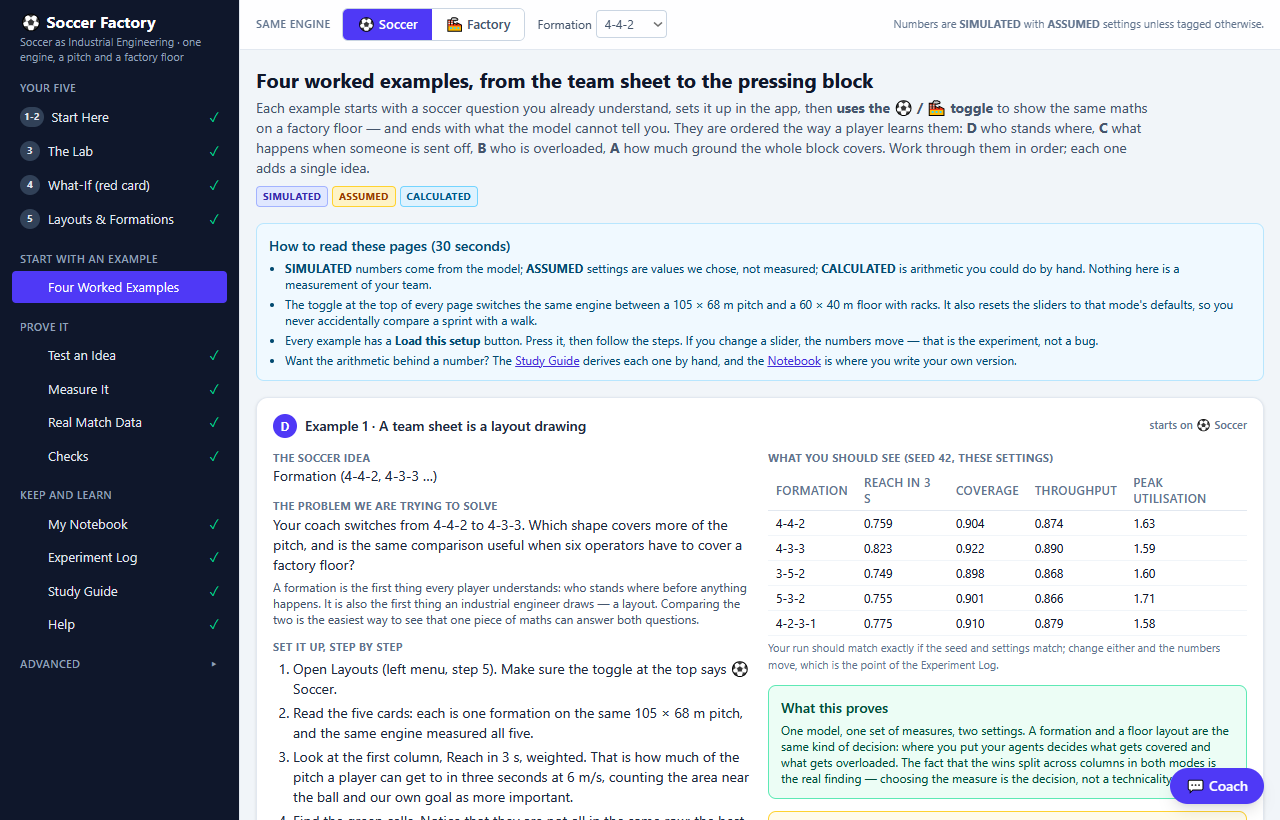
D · A team sheet is a layout drawing
The problem. Your coach switches from 4-4-2 to 4-3-3. Which shape actually covers more of the pitch? And if you were the person laying out a factory floor, would the same comparison help you?
How to set it up.
- Open Layouts & Formations (step 5 in the left menu). Check the toggle says ⚽ Soccer.
- Five cards appear, one per formation, all on the same 105 × 68 m pitch. Under them is a table with five measures.
- Read the first column, Reach in 3 s, weighted: how much of the pitch a player can get to in three seconds at 6 m/s, counting the areas near the ball and in front of your own goal as more important.
- Follow the green cells. They are not all in the same row — that is the point.
| Formation | Reach in 3 s | Coverage | Throughput | Peak utilisation |
|---|---|---|---|---|
| 4-4-2 | 0.759 | 0.904 | 0.874 | 1.63 |
| 4-3-3 | 0.823 | 0.922 | 0.890 | 1.59 |
| 3-5-2 | 0.749 | 0.898 | 0.868 | 1.60 |
| 5-3-2 | 0.755 | 0.901 | 0.866 | 1.71 |
| 4-2-3-1 | 0.775 | 0.910 | 0.879 | 1.58 |
Now use the toggle. Press 🏭 Factory. Same page, same five columns, but the rows are now three ways to lay out six stations, and product has to walk between them:
- Linear flow line — 45.0 m of product travel, coverage 0.984, peak utilisation 0.81.
- U-shaped cell — 73.5 m, coverage 0.978, peak utilisation 1.07.
- Functional (scattered) — 194.9 m, coverage 0.958, peak utilisation 1.14.
With operators evenly spread, the linear line wins everything — and the app warns you not to stop there. Change Operators start as to Depot-based and the wins split: linear still moves product least and covers most, but the scattered layout needs the least capacity (peak utilisation 0.91 against 1.42) and carries the most dead area (438 m²). There is no longer one winner, and saying “this one moves product less, that one keeps the operators less busy” is the engineering answer.
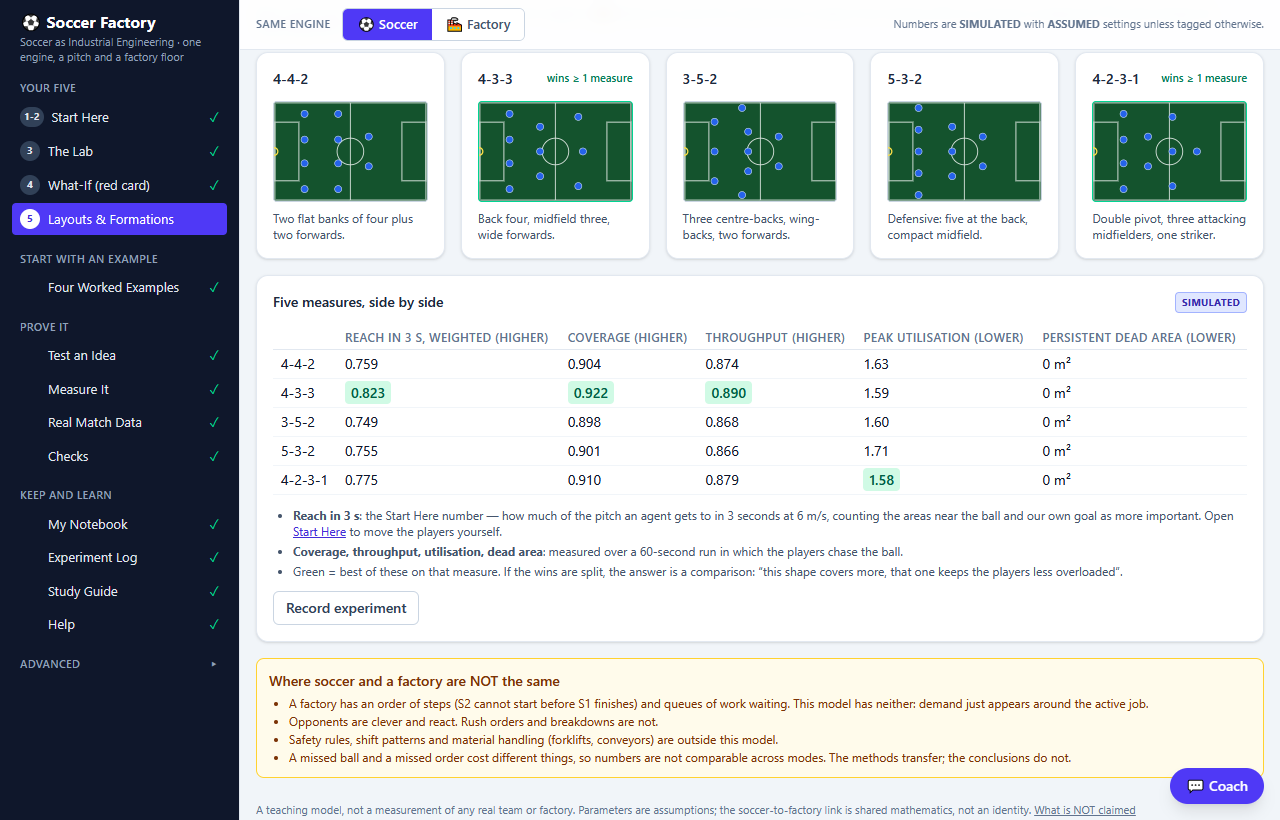
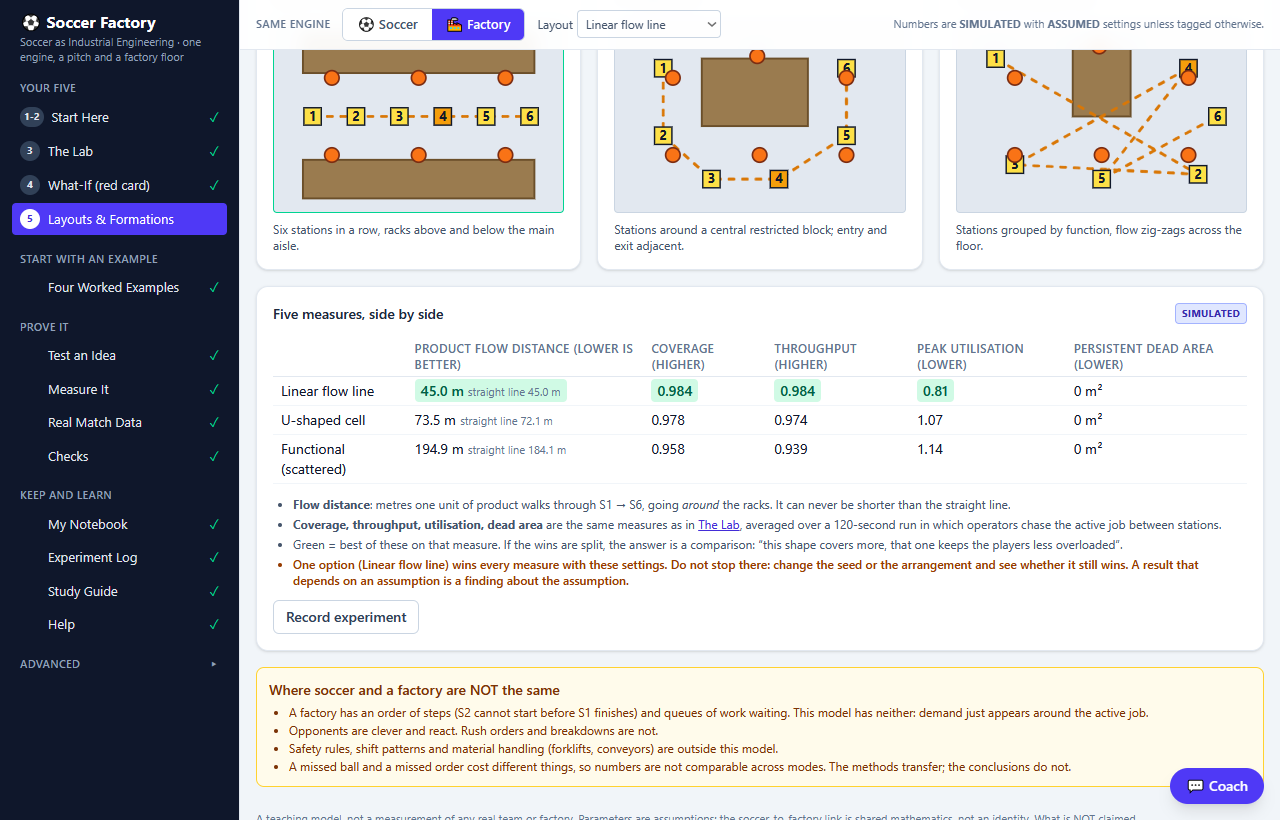
What it proves. A formation and a floor layout are the same decision wearing different kit: where you put your agents decides what gets covered and who gets overloaded.
What it cannot tell you. A pitch has ten opponents trying to beat your shape; a factory has no opponent and a rush order cannot press you. The factory has an order of work (cut before weld before paint) and queues of jobs; this model has neither. Real floors have safety rules and forklift aisles. And formations are coarse — eleven real players do not stand on dots.
C · A red card and a machine breakdown are the same question
The problem. You are 2–0 up and two players get sent off. How much of your defensive coverage does that actually cost, and how long until the team settles again? Industrial engineering asks exactly the same thing about a machine that breaks mid-shift.
How to set it up.
- Open What-If (step 4). Toggle to ⚽ Soccer, formation 4-4-2.
- Tick the box on the row called Player(s) unavailable.
- Click players 8 and 9 in that row: two sent off, eight still playing.
- Set Repeated trials to 10, so the whole simulation repeats along ten different random ball paths — that is where the ranges come from.
- Press Run scenarios and read the five cards left to right: Baseline → Disturbance → Response (lowest) → Recovery → Final.
Now use the toggle. Press 🏭 Factory. The same row is now called Operator(s) unavailable, because the app’s dictionary says a sent-off player is a lost resource — exactly what an absent operator or a broken machine is. Tick it, click operator 2, keep ten trials, run it again.
| Scenario | Peak coverage loss | Retained (min) | Recovery | Recovered |
|---|---|---|---|---|
| Soccer: 2 of 10 sent off | 0.060 (0.037–0.084) | 0.930 | 0.6 s | 100% |
| Factory: 1 of 6 absent | 0.133 (0.119–0.147) | 0.865 | 0.0 s | 100% |
Two players out of ten costs you about six points of coverage. One operator out of six costs about thirteen. Same maths, different slack — the floor has less redundancy than the pitch, and the model shows it without being told.
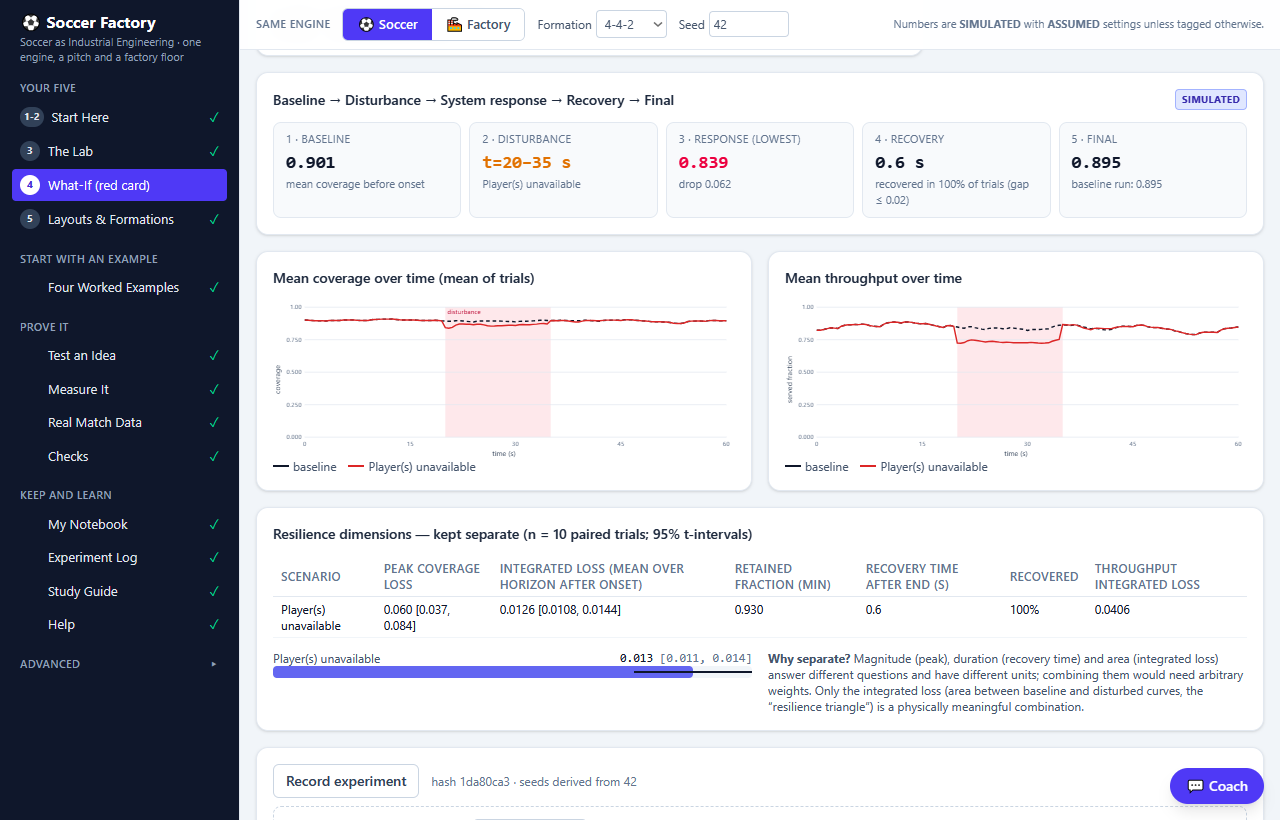
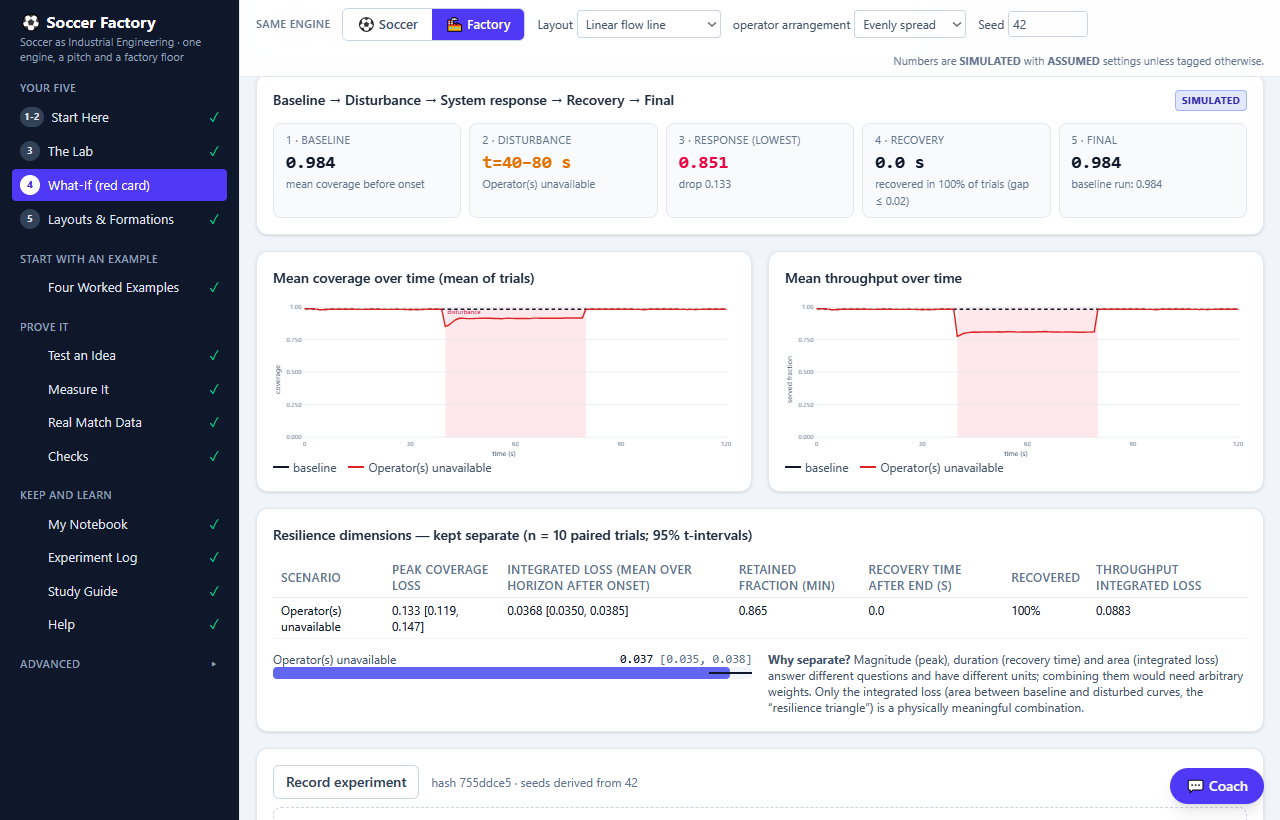
What it proves. A sending-off and a breakdown are one idea in two costumes: remove capacity, watch the system dip, measure the size and the length of the dip.
What it cannot tell you. The opponent in this model wobbles but never attacks the gap you just left. A real machine has a repair-time distribution and a queue of work behind it, so the model cannot tell you how many orders end up late. Recovery looks almost instant because the remaining agents re-plan perfectly — real players tire, argue and take minutes. And a red card in minute 30 is not a red card in minute 85; the model does not know the score or the clock.
B · One player running everywhere is a bottleneck, not a hero
The problem. Your number 8 seems to be everywhere. Is the team failing because it cannot get places in time, or because one player has more work than he can handle? Those two problems look identical from the touchline and need completely different fixes.
How to set it up.
- Open The Lab (step 3). Toggle to ⚽ Soccer, leave the sliders at their defaults.
- Read Peak utilisation: 1.358. Anything above 1 means somebody is being asked for more than they can give.
- Read the sentence under it, not just the number: 8.6% of demand is lost to capacity, and raising every player’s capacity by 20% would add 4.8 points of throughput. That second part is the test — if more capacity buys more output, capacity is the real limit.
- Drag Capacity per player down to about 6. Peak utilisation jumps to 2.727, 37.4% of demand is lost to capacity, and 20% more capacity would now buy 7.2 points.
- Put capacity back to 12 and instead drop Time to arrive to 2 s. The loss changes character: now nobody can get there in time, which is an access problem, not a workload problem.
Now use the toggle. Press 🏭 Factory. At factory defaults there is no bottleneck: peak utilisation 0.795, and only 1.2% of demand is short — all of it access-limited. Drag Capacity per operator down to about 4 and the bottleneck appears: peak utilisation 1.939, 44.2% lost to capacity, and 20% more capacity is worth 10.9 points. The label on the slider changed; the arithmetic did not.
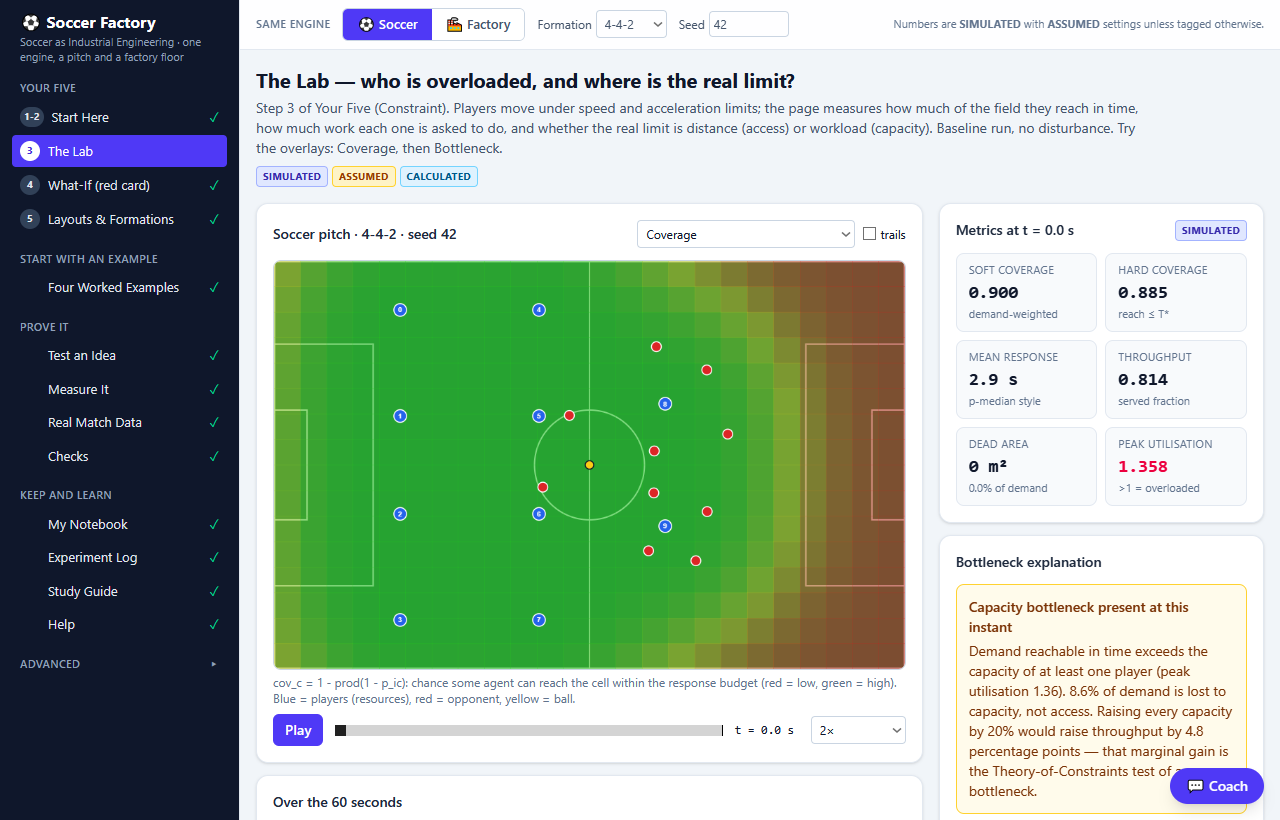
What it proves. A bottleneck is a relationship between demand and capacity, not a place on a map — and that is equally true of a midfield and a workstation.
What it cannot tell you. Capacity here is one number per agent; a real player’s depends on fitness, the score and the minute. The model has no queues, so it cannot show you the work stacking up in front of the bottleneck — which is often the expensive part. And it cannot tell you who to substitute, because it models position, speed and capacity, not skill.
A · How much ground can we actually close in three seconds?
The problem. High press or deep block: how much of the pitch can you genuinely shut down before the opponent plays? And what does “three seconds” even mean on a factory floor?
How to set it up.
- Open Start Here (step 1). Toggle to ⚽ Soccer; the defaults are 3 s at 6 m/s, a reach radius of 18.0 m.
- Read Pitch reached: 70% with 4-4-2, and the red ring marks the worst-served spot 45 m from the nearest player.
- Click 4-3-3 (79%), then 5-3-2 (69%), then Bunch them up (17%). Shape, not effort, is doing the work.
- Drag the yellow ball toward your own goal and switch to 2 · Importance: the plain number stays 70% while “important spots reached” reads 75%, because the area around the ball and your goal now counts more.
- Double-click a player to send him off and watch the number fall. Ask which one costs you most — it is rarely the obvious one.
Now use the toggle. Press 🏭 Factory. The formula is unchanged — reach = speed × time — but an operator walks at 1.4 m/s, so six seconds buys 8.4 m instead of 18. Floor reached is 42%, and the station table underneath reads NO for all six stations: every one is 9.7–10.1 m away from the nearest operator. Drag time to arrive to 15 s and coverage becomes 86%, with a 21 m radius. Nothing about the maths changed; only the constant did.
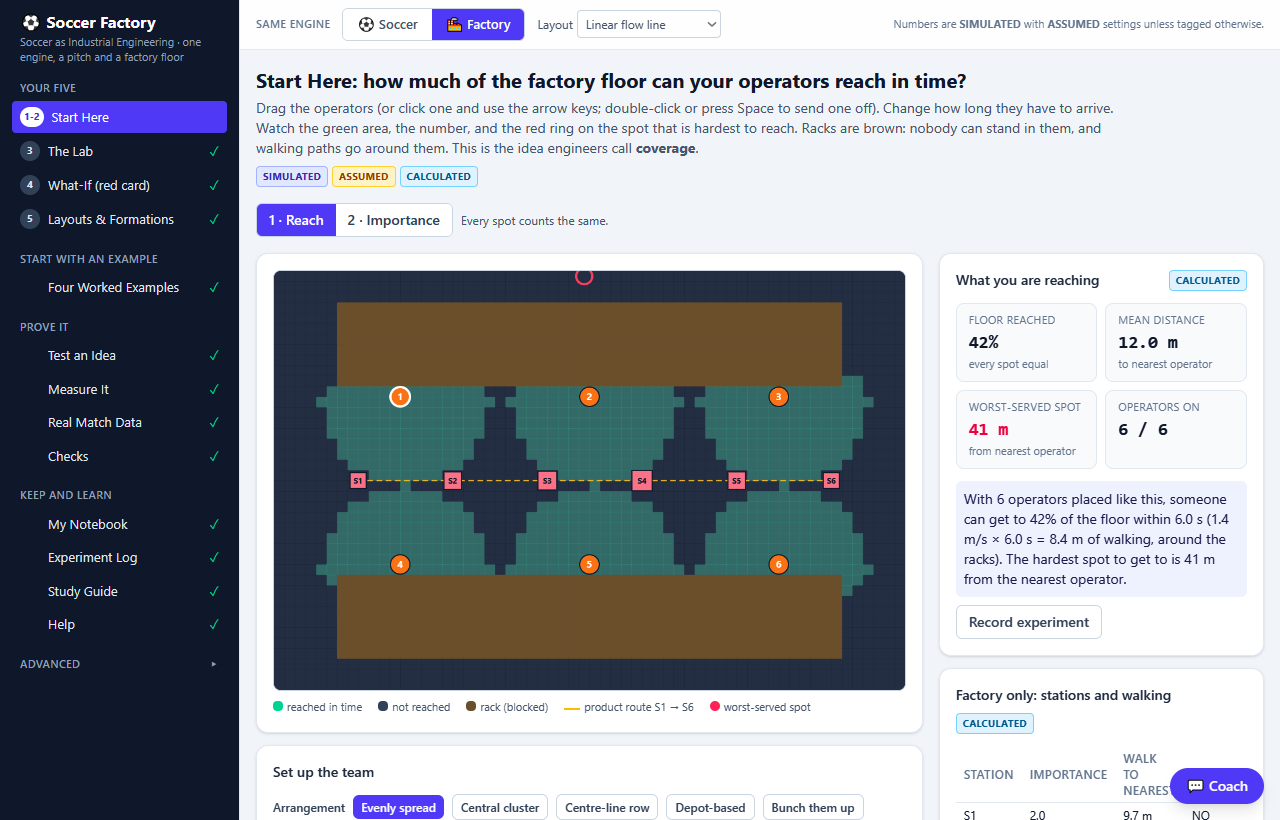
What it proves. Coverage is one formula plus a shape. That is why a pressing scheme and a warehouse layout can be argued about with the same words — and why changing the shape moves the number far more than shouting at players to run harder.
What it cannot tell you. This model’s opponents drift toward the ball; they do not pass into the space you just vacated, which is what a good team would do. There is no offside, no ball travel time and no second ball, and pressing traps are all about passes. The worst-served spot is a distance, not a danger — the Importance step only adds that crudely. On the floor side, walking distance is not the time to finish a task at a station, so service coverage is not the same as completed work.
What the toggle is really doing
It is not a skin. The same TypeScript engine changes three constants and one vocabulary: pitch 105 × 68 m and running at 6 m/s becomes a floor 60 × 40 m with racks and walking at 1.4 m/s, players become operators, the ball becomes the active job, a closed zone becomes a rack, your own goal becomes the critical station. Every measure on every page is computed by the same code, which is why the comparison is worth making. It also resets the sliders to that mode’s defaults, so you cannot accidentally compare a sprint with a walk.
Under the hood, briefly
- No accounts, no downloads. Plain HTML/JS on the front, a small PHP + SQLite API behind it. Your saved experiments and notebook live in your own browser; nothing about you is stored.
- The AI Coach explains, it never computes. Press 💬 Coach and it explains the numbers on the page — it is told never to invent data and to label results SIMULATED. Because the demo carries a real API key, the first use asks you one sum (16 + 40 = ?) and keeps that browser unlocked for 24 hours. That is not a login: it stops scripts from draining the key. Saving experiments works without it, and the Study Guide needs no AI at all.
- Honesty is a feature. Every number carries a tag — SIMULATED, ASSUMED, CALCULATED, ESTIMATED, MEASURED — and the Build Notes page lists what the project does not claim.
- It works on a phone, one-handed, on a pitch, with no signal needed once loaded.
Tools and approach
- MODEL — a pure TypeScript simulation engine: spatial coverage on a grid, capacity and utilisation, disturbance and recovery, Monte Carlo repeats, simulated annealing for layout optimisation, plus a Metrica-format tracking parser that estimates real speed limits from CSV data.
- TOOLS — Vite + React + Tailwind for the front end; PHP 8 + SQLite for the experiment log and the Coach; DeepSeek deepseek-flash behind a one-sum gate for the explanations; Cloudflare and Coolify for hosting.
- BUILT WITH — 49 engine verification cases, 13 API tests, 47 real-browser checks over CDP (every page, the toggle in both modes, the worked examples, and the full gate: locked → wrong sum refused → right sum → live answer). Screenshots for this page were captured by a script, not by hand.
- NOTE — every result is SIMULATED under ASSUMED parameters. This is a teaching model, not a measurement of your team or any real plant. The soccer-to-factory link is shared mathematics, not an identity.
Review
THE GOOD
- The toggle earns its place. It is not decoration: the formations page really does compare five shapes on a pitch and three layouts on a floor with the same five measures.
- The four examples carry their own numbers and their own limits, so a student can check the claim instead of trusting it.
- The engine refuses to give one score. Where a layout wins everything it says so and tells you to change an assumption and look again.
- 49 + 13 automated checks plus 47 browser checks, and the Coach gate is tested end to end rather than assumed to work.
THE BAD
- It is a big app for a first visit: fifteen pages, and the advanced ones (Optimization, Monte Carlo) are only meaningful after the first five. The worked-examples page exists because the menu alone did not solve that.
- Facility mode has no queues and no order of operations. Those are the two things that make real industrial engineering hard, and they are deliberately out of scope here.
- Two players sent off only costs about six points of coverage in this model. A coach will tell you it feels worse than that, and the coach is right — the model has no opponent exploiting the gap.
- Numbers are only comparable within a mode. A missed ball and a late shipment are not the same unit.
TO IMPROVE
- Add a queue in facility mode so the bottleneck page can show work stacking up, not just utilisation above 1.
- Give the opponent a policy that attacks the space you leave, so pressing traps can be modelled instead of only described.
- Let a student save a whole example as a shareable link (seed, mode and sliders in the URL) so a class can compare the same run.
What we learned
- The analogy is only useful where it is exact. Coverage, utilisation and recovery transfer cleanly because they are the same equations. Opponents, queues and safety rules do not transfer, and the app says so on every page that leans on the analogy.
- A number without its limits is a sales pitch. The most valuable part of each example turned out to be the “what it cannot tell you” list, not the results table.
- Order matters for teaching. The app’s own menu teaches reach first because that is the founding idea — but a player learns a team sheet before a pressing block. Reordering the examples D → A (formation → red card → overload → pressing) made the whole thing easier to walk into than the app’s own sequence.
- A public demo with a paid API needs a door, not a login. One sum once per browser costs a visitor four seconds and keeps the key from being scripted, without storing anything about them.
Open Soccer Factory — start with the Four Worked Examples, then press the toggle.